Mastering Stock Market Charts: Tools for Serious Investors
Unlock the secrets of stock market charts with essential technical analysis tools. Understand trends, momentum, breadth, and support levels to make informed investment decisions.

Investing in the stock market can feel like navigating a labyrinthine maze, especially when trying to predict its next move. While fundamental analysis provides insight into a company's financial health through metrics like earnings and debt, technical analysis offers a different approach. It employs various tools and indicators to interpret price movement and market sentiment, allowing investors to make more informed decisions. Whether you are a seasoned trader or a novice, understanding how to read stock market charts can enhance your investment strategy, enabling you to spot trends and potential reversals before they happen.
In this article, we will delve into four critical technical tools that can elevate your chart-reading skills. These tools will help you identify market trends, measure momentum, assess market breadth, and recognize key support and resistance levels. By mastering these indicators, you can gain a more comprehensive understanding of market dynamics and improve your trading outcomes.

Understanding Market Trends
Recognizing market trends is foundational in technical analysis. Trends can be upward, downward, or sideways, and identifying them can provide valuable insights into market direction. One of the most reliable indicators for spotting trends is the moving average, particularly the 200-day simple moving average (SMA). This moving average averages the price of an asset over the last 200 trading days, smoothing out short-term fluctuations and revealing the longer-term trend.
How to Use the 200-Day Moving Average
To utilize the 200-day SMA in your analysis, you can follow these steps:
- Access a charting platform through your broker or a financial website.
- Load a long-term chart of your chosen index or stock, such as the S&P 500.
- Overlay the 200-day moving average on the price chart.
If the asset's price is above the 200-day SMA and the line itself is sloping upward, it indicates a bullish market trend. Conversely, if the price is below the 200-day SMA and the line is sloping downward, it suggests a bearish trend. As of May 31, 2026, the S&P 500 closed at 7,580, above its 200-day average of 6,831, indicating a continued bullish trend. However, a caveat exists: only 55% of S&P 500 stocks were trading above their 200-day moving average, a decrease that suggests underlying weakness in broader market participation.

Measuring Momentum with the Relative Strength Index
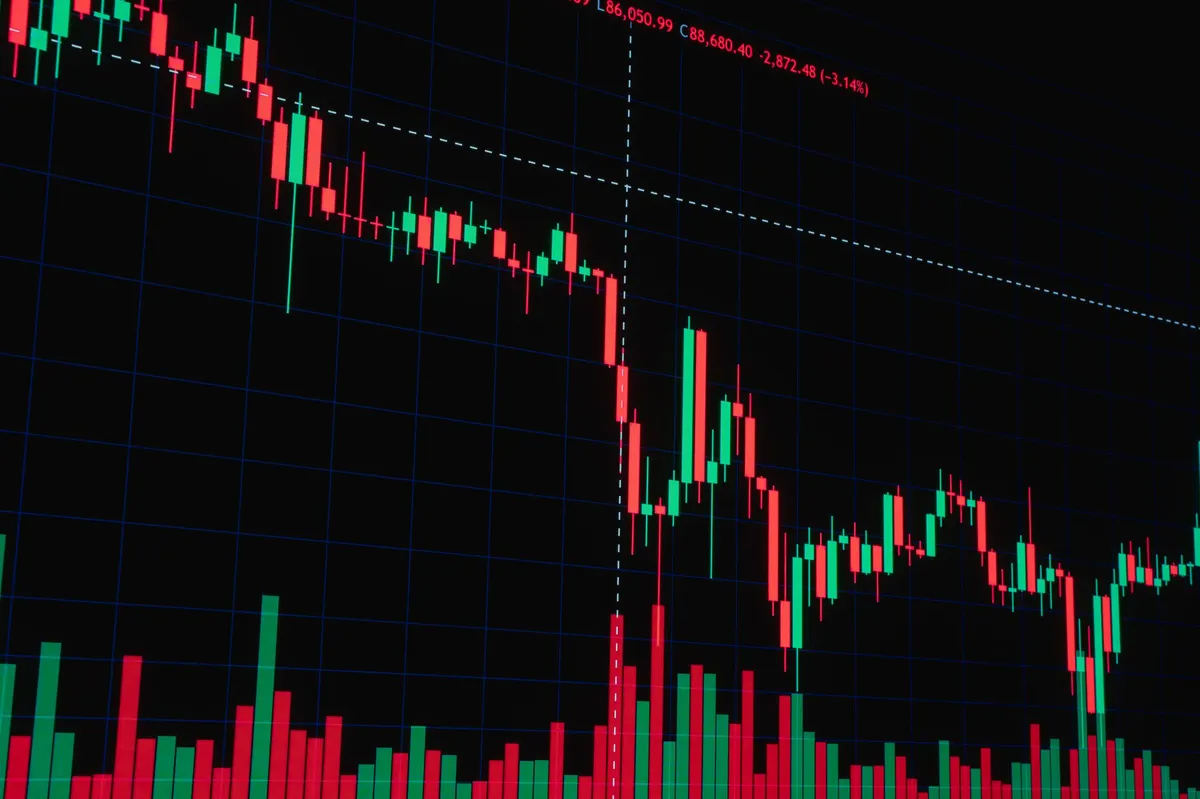
Momentum is another critical aspect of technical analysis, often signaled by the Relative Strength Index (RSI). The RSI is a momentum oscillator that measures the speed and change of price movements, giving traders an idea of whether a stock or index is overbought or oversold. This indicator is plotted on a scale from 0 to 100, with readings above 70 indicating an overbought condition and those below 30 suggesting oversold conditions.
Interpreting RSI Values
To effectively use the RSI in your trading strategy:
- Monitor the RSI value regularly, especially during significant market movements.
- Consider the RSI in conjunction with the broader market trend. An overbought RSI in a bullish market can still indicate potential for further upside.
- Look for divergence between the RSI and the price chart, which can signal potential reversals.
For instance, a reading of 74 on May 31 indicated that the market was overbought, suggesting caution for investors. However, if the broader trend remains upward, the stock may still have room to run before a correction occurs.
Assessing Market Breadth
Market breadth is a measure of how many stocks are participating in a market move, and it can provide critical insights into the sustainability of a trend. A breadth indicator, such as the Advance-Decline Line, tracks the number of advancing versus declining stocks within a given index. A strong uptrend should ideally see a higher percentage of stocks advancing than declining. Conversely, a weak trend may exhibit a higher number of declining stocks.
Interpreting Market Breadth
Here's how to assess market breadth:
- Track the Advance-Decline Line alongside major indices like the S&P 500.
- Look for divergences between stock price trends and breadth indicators.
- Be cautious in uptrends where breadth is weak, as this may indicate a lack of conviction in the market rally.
As of the end of May, the declining breadth with only 55% of S&P 500 stocks above their 200-day moving average raised concerns among analysts. Ideally, a robust market would see 70% to 80% of stocks participating in the rally, indicating strong underlying momentum.
Identifying Support and Resistance Levels
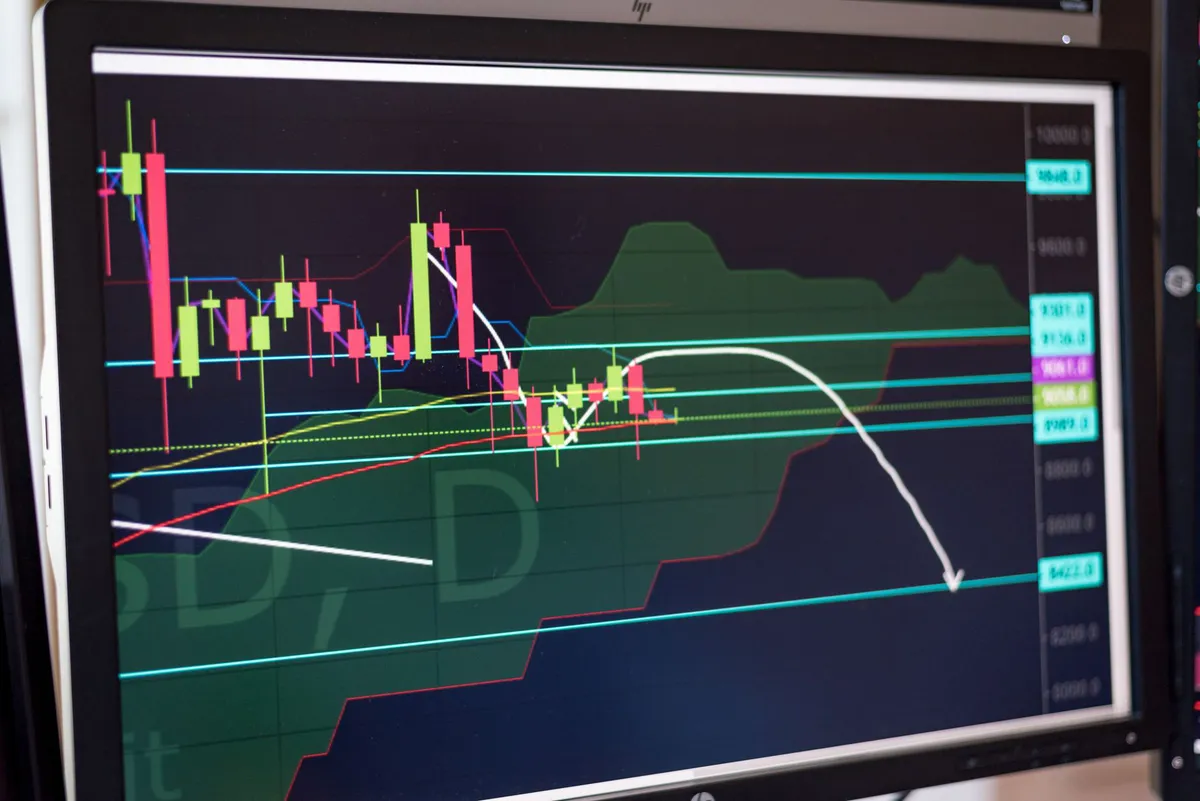
Lastly, understanding support and resistance levels is crucial for making informed trading decisions. Support levels are price points where an asset tends to stop falling and may bounce back, while resistance levels are where the price typically stops rising. Identifying these levels can help traders set entry and exit points for their trades.
How to Spot Support and Resistance
To effectively identify these levels:
- Review historical price charts to find previous highs and lows.
- Observe how prices react when approaching these levels, as these can indicate future behavior.
- Use horizontal trendlines to mark these key levels on your charts.
A classic example is when a stock approaches a resistance level and fails to break through. This could indicate a potential sell signal as the stock may reverse direction. Conversely, if a stock bounces off a support level, it may indicate a buying opportunity.
Key Takeaways
- Understanding market trends through indicators like the 200-day moving average can guide investment decisions.
- The Relative Strength Index (RSI) provides insights into momentum, signaling potential buy or sell opportunities.
- Market breadth analysis helps assess the strength of a trend and potential reversals.
- Identifying support and resistance levels is vital for setting effective trading strategies.
- Combining technical analysis with fundamental insights can enhance overall investment strategies.
Frequently Asked Questions
What is technical analysis and how does it differ from fundamental analysis?
Technical analysis focuses on price movements and historical market data to predict future price trends. In contrast, fundamental analysis evaluates a company's financial health, including income statements and balance sheets, to assess its intrinsic value. While fundamental analysis can help determine if a stock is undervalued or overvalued, technical analysis provides tools to time entry and exit points based on market trends and sentiment.
How can I start using technical analysis for my investments?
To get started with technical analysis, familiarize yourself with key indicators such as moving averages, RSI, and support and resistance levels. Utilize charting software available from most online brokers to track these indicators. Begin by applying these tools to a few stocks or indices you are interested in, gradually building your understanding of how they interact with price movements over time.
Is technical analysis suitable for long-term investors?
While technical analysis is often associated with short-term trading strategies, it can also be beneficial for long-term investors. By understanding market trends and key price levels, long-term investors can make better decisions about when to enter or exit positions. Integrating technical analysis with fundamental research can provide a more well-rounded investment strategy.
What should I watch for in the current market using technical indicators?
In the current market, keep an eye on the relationship between the S&P 500's price and its moving averages, as well as the RSI readings to identify overbought or oversold conditions. Additionally, monitor market breadth to assess whether the rally is supported by a wide range of stocks. Finally, be alert to any divergences between price movements and technical indicators, as these can signal potential reversals or shifts in market sentiment.
This content is educational and not financial advice.
Comments
Alternative Investments: Expanding Access with Smart Guardrails
As the debate on alternative investments for retirement accounts heats up, it's crucial to establish structured access that provides everyday investors with opportunities to diversify their portfolios. Learn how guardrails, rather than bans, can make these assets accessible for all.

Related articles







Popular in Investing
- Navigating the Dismal Landscape of 2026's Worst-Performing ETFs
- Stablecoin Market Faces $10 Billion Decline — What It Means for Investors
- Avantus Secures $525 Million for Major California Solar Project
- Navigating the Pet Stocks Market: Opportunities Amidst Challenges
- Market Turmoil: How Geopolitical Tensions and Earnings Reports Impact Stocks