Block Inc. Shows Bullish Signs After Recent Pullback: What Investors Should Know
Block Inc. has displayed a bullish signal following a recent pullback, prompting investor interest. This article delves into the stock’s performance, market context, and potential investment strategies.
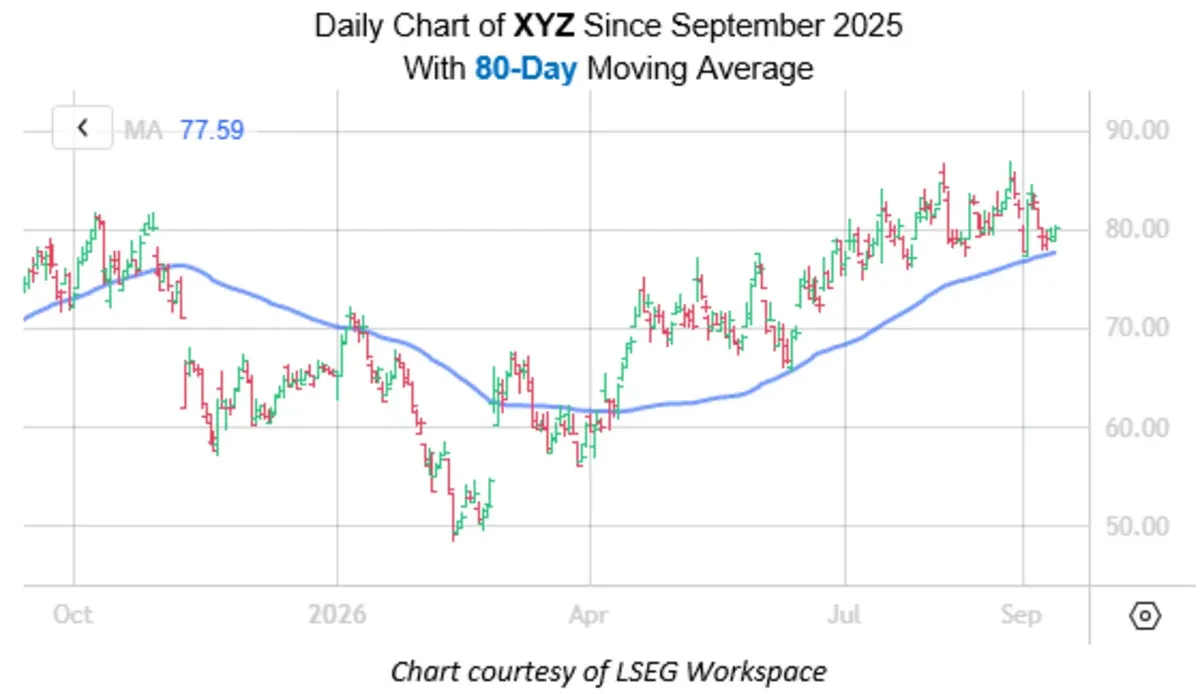
In the fast-paced world of fintech, Block Inc. (NYSE: XYZ) has recently caught the attention of investors and analysts alike. After experiencing a sharp pullback from its 52-week high of $86.90 on August 27, the stock has shown signs of recovery, currently trading at $80.45—up 1.6% for the day and boasting an impressive 23.1% gain year-to-date. As the stock finds its footing, market analysts are closely watching its movements, particularly in light of historical trading patterns that suggest a potential bullish trend.
Understanding the recent fluctuations in Block Inc.'s stock price is essential for investors looking to capitalize on its next move. The combination of technical indicators and historical performance can provide valuable insights into the future trajectory of this fintech giant.
Understanding Block Inc.'s Recent Performance
Block Inc. has faced a volatile trading period, with its stock price dipping significantly from its peak in late August. Despite this downturn, the stock's resilience is noteworthy. The 80-day moving average has acted as a support level, preventing further losses and indicating a potential reversal in trend. According to Rocky White, a Senior Quantitative Analyst at Schaeffer's, the stock has spent a considerable amount of time trading above this moving average, which is a positive sign for investors.
Current Price and Historical Context
As of September 14, Block Inc. is trading at $80.45, reflecting a recovery following a recent slump. In the context of its year-to-date performance, the stock’s 23.1% gain is significant, especially when compared to broader market trends. The recent pullback can be attributed to various factors, including market correction, investor sentiment, and macroeconomic conditions that have impacted the fintech sector.
Technical Indicators and Their Implications
Block Inc.'s stock behavior has exhibited patterns that could imply future price movements. The stock has traded within 0.75 times the 80-day moving average's 20-day average true range (ATR), a technical indicator that measures price volatility. Historically, this setup has occurred 14 times over the last decade, leading to a higher stock price one month later 62% of the time, with an average gain of 4.8%. This historical context provides a basis for cautious optimism among investors.
Low Volatility Environment
Another critical factor to consider is Block Inc.'s Schaeffer's Volatility Index (SVI), currently at 39%, which places it in the low ninth percentile of its annual range. This low volatility suggests that options traders are not expecting significant price swings in the near term, which might present a strategic opportunity for investors looking to engage with options trading. A low SVI can often indicate that the stock is more stable, providing a conducive environment for potential upward movement.
Investment Strategies Moving Forward
Given the current market conditions and Block Inc.'s performance indicators, investors may want to consider several strategies moving forward. Here are some potential approaches:
- Long-Term Holding: Investors who believe in Block Inc.'s long-term growth potential may choose to hold onto their shares, especially given the stock's strong year-to-date performance.
- Options Trading: With the low volatility environment, options traders might find value in strategies such as selling covered calls or exploring bullish call spreads to capitalize on potential upward movements.
- Diversification: As with any investment, it’s prudent to maintain a diversified portfolio. Investors should consider balancing their holdings in Block Inc. with other fintech and tech stocks to mitigate risk.
Key Takeaways
- Block Inc. stock has shown resilience after a recent pullback, currently trading at $80.45.
- The stock has historical patterns indicating potential bullish trends, having risen after similar setups 62% of the time.
- Low volatility, as indicated by the SVI, suggests stability, opening opportunities for options trading.
- Investors should consider long-term holding, options strategies, and diversification to navigate the current market environment.

Frequently Asked Questions
What factors contributed to Block Inc.'s recent stock pullback?
The recent pullback in Block Inc.'s stock price can be attributed to a combination of market corrections, shifts in investor sentiment, and broader economic factors affecting the fintech sector. As investors react to changing news and forecasts, stock prices can be influenced by both external and internal pressures, leading to short-term volatility.
How can I determine if now is a good time to invest in Block Inc.?
To assess whether it’s a good time to invest in Block Inc., consider analyzing key technical indicators like moving averages, historical performance, and volatility levels. Additionally, reviewing the company's financial health, market position, and growth prospects can provide further context to inform your investment decision. Consulting with a financial advisor can also enhance your understanding of market dynamics.
What are the risks associated with investing in fintech stocks like Block Inc.?
Investing in fintech stocks carries inherent risks, including market volatility, regulatory changes, and competition from both traditional financial institutions and emerging fintech startups. Additionally, the rapid pace of technological change can impact a company's ability to innovate and maintain market share, making it crucial for investors to remain informed and vigilant.
Comments
Starbucks Initiated, Expedia Downgraded: Key Wall Street Moves Explained
Discover the latest Wall Street analyst calls as Starbucks receives coverage initiation while Expedia faces a downgrade. Explore how these changes impact investors.

Related articles







Popular in Investing
- Navigating the Dismal Landscape of 2026's Worst-Performing ETFs
- Navigating the Turbulent Waters of Energy Markets: A Deep Dive
- Stablecoin Market Faces $10 Billion Decline — What It Means for Investors
- Cotton Futures Surge Despite Increased Production Forecasts
- Avantus Secures $525 Million for Major California Solar Project